The reading graph appears while you are taking the reading on the app and is available in the recovery section on the HRV Health platform. What does it mean, and what should you look out for?
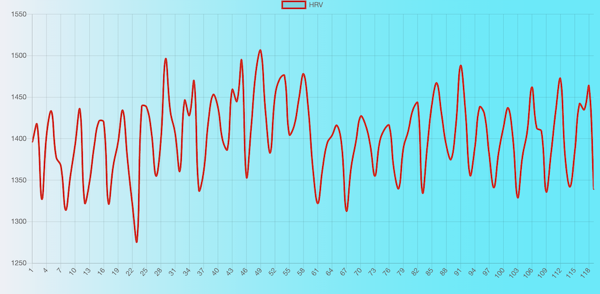
When you are well, and you are taking the reading in a completely relaxed state, the pattern of variation in the heart rate is regular. This is what mine looked like when I was well:

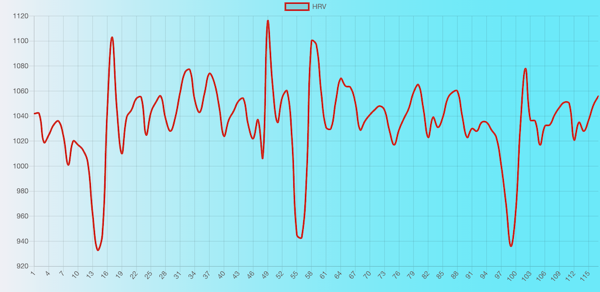
Recently, I have had a decline in my health, as a result of the issues described in the article: HRV and smoking. This is what the reading graph look like now:

The more irregular the variation, the more indicative it is of illness.
The graph may vary from one day to another. It’s a signal of the ups and downs in your health. Having a perfectly regular variation every day is a sign of remarkably good health. That’s what we are striving for, and what some of our users are achieving.
Good luck getting there.
